All Blogs with tag:
data visualization

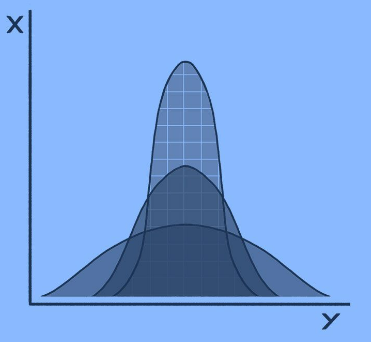
Understanding Variance and Standard Deviation in Python
Variance and standard deviation are two commonly used measures of statistical dispersion. They can be used to quantify the amount of variation or dispersion of a set of values. In this blog, we'll learn how to calculate variance and standard deviation in Python without importing any modules.

A Comprehensive Guide to Understanding and Visualizing Frequency Tables
Frequency tables and histograms are two of the most commonly used tools in statistics for representing and visualizing data. In this guide, we will explore the basics of frequency tables and histograms, including how to create frequency tables, calculate relative frequencies, and visualize the data with histograms.
